



Today · Design system service
We build it with you
Every design system is built by people who have worked in dataviz since 2012, with Pier's catalogue of 85 charts behind every decision.
Services · Dataviz design systems
A design system for your charts, from how axes are labelled to how captions are written, built for every medium your data appears in.
More than chart rules
Most chart guidance stops at rules like this. A dataviz design system is a strategy for building data visualisations, for insights and experiences, designed for the medium they're seen in.
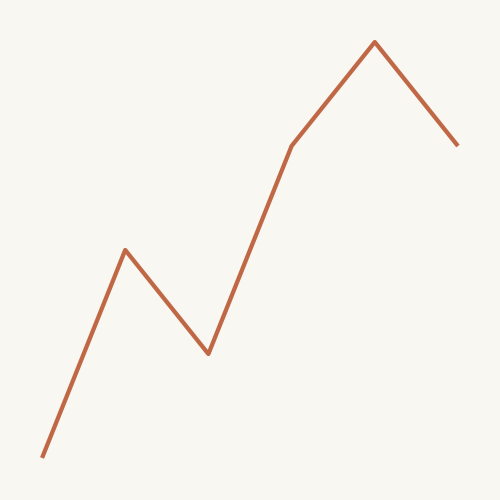
Where most guidance stops
"Use line charts instead of bar charts"

Which charts from the 85 in our catalogue you use, for which questions, and which you don't.
Titles that state the finding. Subtitles that carry units, scope and time period.

Direct labels or legends, number formats, units, tick density and when an axis starts at zero.

What a caption says, how notes and sources are written, and where they sit.

Categorical, sequential and highlight palettes, tested for contrast and colour vision.
How you call out the moment that matters, consistently, chart after chart.

Alt text, data tables, keyboard and screen reader behaviour, checked against POUR-CAF.

How every decision above changes for each place people meet your data.
Medium is part of the system
A chart in a deck is seen for seconds. A chart in a data portal is checked line by line. Your design system decides what changes for each.

Charts dropped into chat, email and AI assistants. Seen small and out of context, so the title and caption carry the whole message.

Charts inside your product. Rules must be precise enough for developers to build, and work with a keyboard and screen reader.
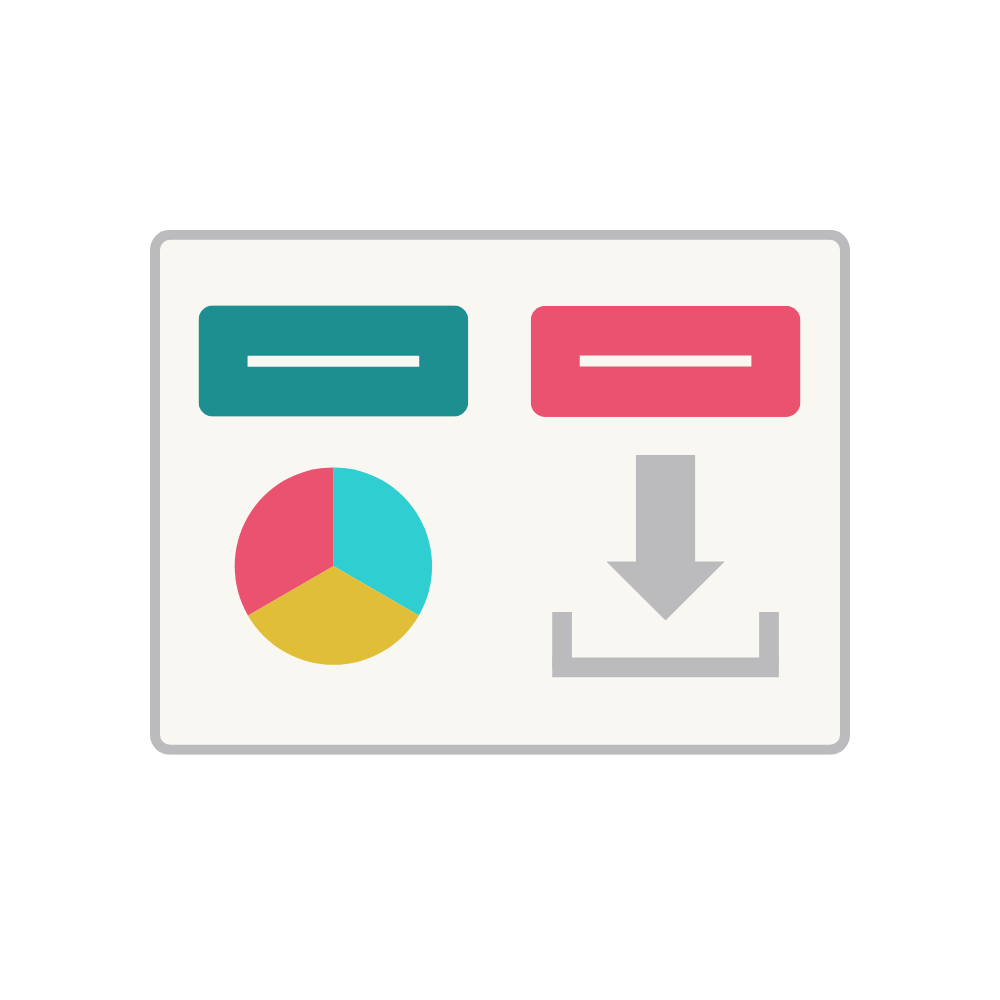
Statistical releases and open data. Readers want to check and reuse, so every chart comes with its table, download and source.

Articles and web pages, mostly read on phones. Charts reflow down to 320px and annotate the story, not just the numbers.

PDF and print. Static and read slowly, with numbered figures, full captions and tagged alt text.

Checked again and again by the same people. Same positions, colours and scales every visit, so change means change.
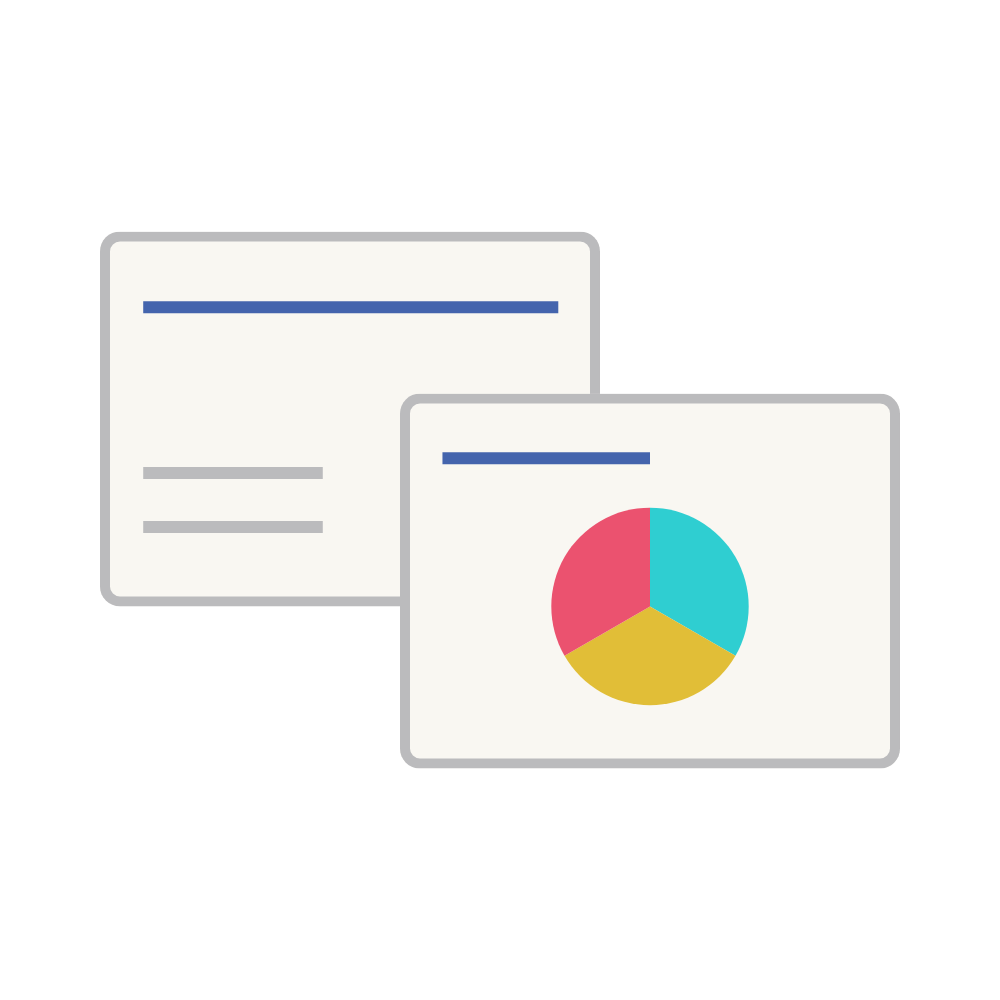
Presented in a room or on a call and seen for seconds. One message per chart, written as the slide title.
One system, every tool
Your analysts use Excel and Power BI, your designers use Figma, your developers use a charting library. The design system is the same for all of them. Where a tool needs its own answer, the system makes that decision too.
How it works
We gather the charts you publish, across every medium, and see where they disagree.
We build the system with your designers, analysts and developers, so it fits how you work.
Written guidance plus tool-specific themes, templates and specs.
A workshop with your team, so the system gets used, not filed.

Built by people, powered by Foundry
Today · Design system service
Every design system is built by people who have worked in dataviz since 2012, with Pier's catalogue of 85 charts behind every decision.
Next · Foundry
Foundry is the studio in Pier for building and running your dataviz design system, so every chart your team makes starts on-system.
Get in touch at hello@visibledata.io or use the form below. We promise we'll be honest about how and if we can work with you.